
Reports
The Reports tab turns your logged data into charts and personal records.
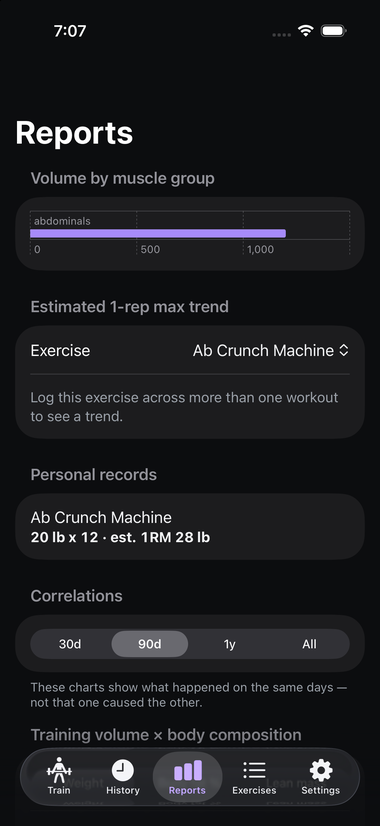
Volume by muscle group#
A bar chart of total training volume — see Volume — attributed to each muscle group, based on the exercises you've logged and the muscle groups assigned to them. Sessions logged only with custom exercises that have no muscle groups assigned won't show volume here; see Exercise Library for how to fix that on a custom exercise.
Estimated 1-rep max trend#
Pick an exercise from the dropdown to see how your estimated one-rep max for it has changed over time (see 1RM). You'll need to have logged that exercise across more than one workout before a trend line has anything to show — until then, you'll see a note explaining exactly that instead of an empty chart.
Body-weight trend#
A line chart of your logged body weight over time, drawn from your Body Metrics entries — including history backfilled from Apple Health if you've connected it, not just weight you've entered by hand in Datum.
Nutrition trend#
A trend chart for each of calories, protein, carbs, fat, sugar, and water. This section only has data if you're logging food in another app that writes to Apple Health — Datum doesn't have its own food-logging screen, it only imports and charts what's already there. See Apple Health Integration for exactly what's imported and why some values might show up blank.
Personal records#
Your best weight and best estimated 1RM for each exercise, tracked independently of each other — see PR. They don't have to come from the same session; you might set a weight PR one day and a 1RM PR (from a higher-rep set) another day entirely. This section (and the volume and 1RM-trend sections above) only covers rep-based exercises — a time-based exercise doesn't have a meaningful weight, 1RM, or weight × reps volume.
Longest holds#
Your best logged duration for each time-based exercise — the hold equivalent of a personal record, tracked the same way (a warm-up set is never a max effort, so it's excluded here too).
Activity minutes#
If you've logged any classes or cardio activities, Datum shows a bar chart of total minutes per activity type, and a trend chart of total activity minutes per session over time. Both are hidden entirely until you've logged at least one finished activity — there's no empty-state message cluttering the tab if you don't use this feature.
Correlations#
The Correlations area looks for relationships between your training, body composition, and nutrition, using a shared date-range picker (30 days / 90 days / 1 year / all time):
- Same-day nutrition × training performance
- Calories in × calories out × body weight
- Protein intake × lean mass
- Training volume × body composition (weight, body fat %, or lean mass — your choice)
Each pairing shows its own empty state ("not enough overlapping data logged in this range yet") independently of the others, and the app is explicit that these charts show what happened on the same days — not that one caused the other.
Correlations need real overlapping data to be meaningful. Training volume only comes from workouts logged in Datum itself, while body-metric and nutrition history can backfill automatically from existing Apple Health data if you connect it (see Apple Health Integration) — so if you've been using Apple Health before switching to Datum, that history doesn't need to be re-entered by hand.